
Emerging markets top of the class for investors
Emerging markets and China have resisted concerns over rising COVID-19 infections afflicting investors in the rest of the world
3 min read
SHARE
Most Popular
-
Ukraine invasion: Keeping our clients informed | Coutts
15 Mar 20221 min
-
Coutts and charitable giving in the Covid era
02 Dec 20214 min

Become A Client
When you become a client of Coutts, you will be part of an exclusive network.
After signs of recovery from the September sell-off, developed markets fell back in the red towards the end of October. The MSCI All Country World index fell -4.5% in the last week of the month – its steepest fall in a single week since March. Overall, the index was down by -2.5% by the end of October.
The global data included some important variations, however, as emerging markets – and particularly China – surged ahead. While the US, Europe and UK were all negative, the MSCI Emerging Markets Index was up 1.5% and MSCI China up a remarkable 5.2%.
(Market performance stated in local currency terms, including income.)
Lockdown 2.0 and US election gnaw at investor confidence
On the positive side, US companies reporting how much money they made in the third quarter earned more than had been expected. At the time of writing, the earnings per share of companies listed on the S&P 500 was nearly a fifth higher than analysts predicted earlier in the period.
But market reaction was muted as investors focused on a contentious election, uncertainty around US stimulus plans, and rising levels of COVID-19 infections. The US became the first region to record 100,000 new daily cases, while lockdown measures have been reintroduced across Europe and the UK to try to slow the spread of the disease. This has led to rising concerns about the likely economic impact, driving falls in developed equity markets.
Global investing takes the edge off volatility
Despite volatile equity markets, a globally diversified approach and some good investment choices helped offset falls in some areas of the market.
For example, we reduced our holdings in US equities in October and used the proceeds to add to emerging markets, which proved beneficial as they surged ahead. Our direct allocation to Chinese equity was also helpful. UK equities had a particularly tough month, but a low allocation and good investment choices limited the impact for our clients.
But our bias to equities over more defensive areas of the market still made itself felt. Defensive portfolios performed the best as investors shied away from risk, falling -1.0 % on average over the month. With their high allocation to equities, growth portfolios had a more challenging month, falling by -2.1%. The average balanced portfolio fell by -1.6%.
As long-term investors, we’re focused on years rather than months, and returns remain positive over both three and five years. Our five-year performance is consistently ahead of industry averages for similar strategies, demonstrating the effectiveness of our investment decision making processes and expertise.
As ever, you shouldn’t rely on past performance as an indicator of future returns. The value of investments, and the income you get from them, can go down as well as up and you may not get back the amount you invested. These figures provide a limited snapshot – for more context please refer to the table of long-term returns at the end of this article.
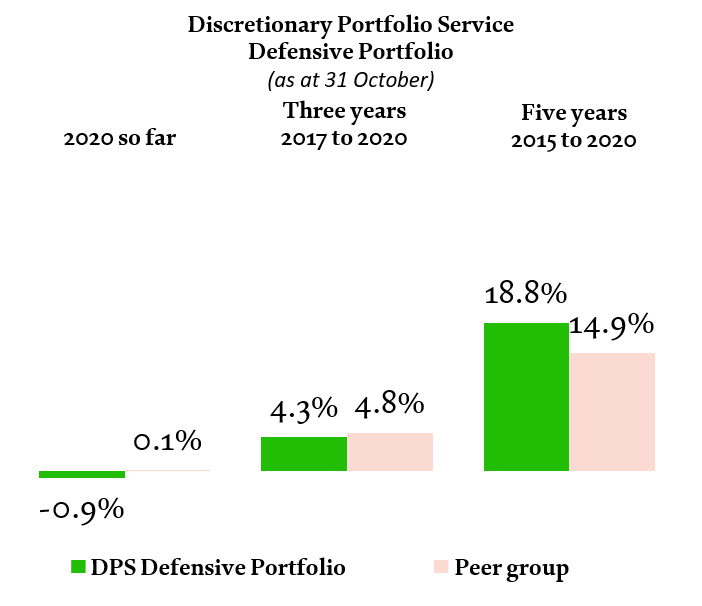
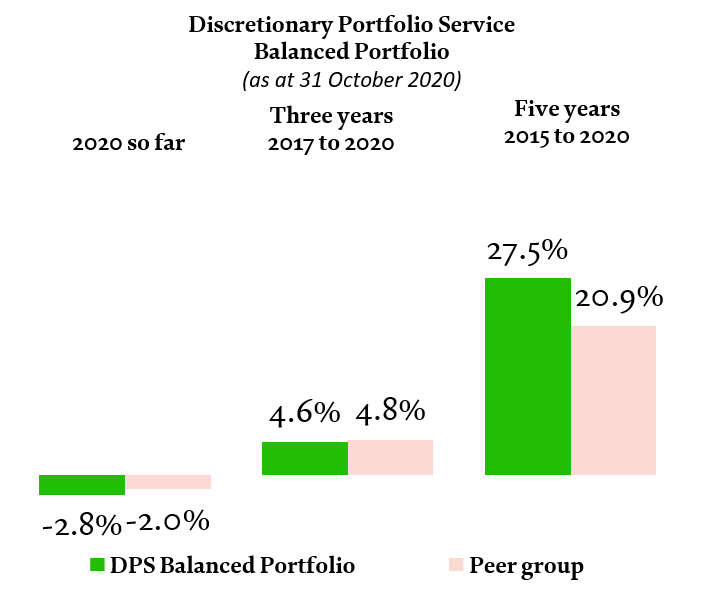
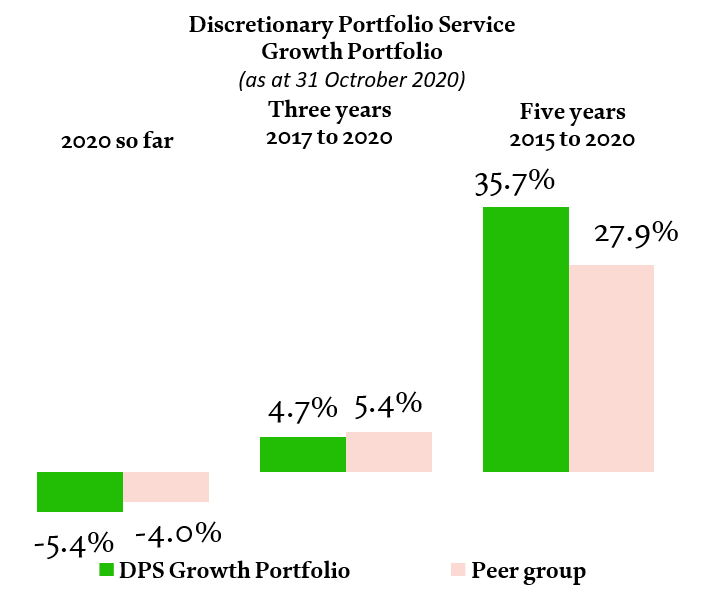
Cumulative returns calculated on sterling basis, including fees, charges and income to 31 October 2020. These data are based on composite performance, individual portfolio monthly returns are asset-weighted based on their respective asset values at the beginning of the month. Peer group returns provided by Asset Risk Consultants (ARC); end-October data represents ARC estimate. Past performance should not be taken as a guide to future performance. The value of investments, and the income from them, can go down as well as up and you may not recover the amount of your original investment. Sources: Coutts & Co, ARC. November 2020.
Investors dive back in as ‘blue wave’ doesn’t make it to shore
November sees the end of one of the major sources of market uncertainty, with the US election finally coming to an end. Markets had signalled that investors were expecting a ‘blue wave’ that would have given the Democratic Party control of the presidency and both houses of Congress. But the result was much closer than the polls had predicted and markets re-adjusted as this became clear.
In the meantime, the US economy seems to be perking up despite a tumultuous few months. Purchasing managers indices show that the outlook for both the manufacturing and services sectors has bounced back.
The Conference Board US Leading Economic Indicators Index – which brings together 10 economic indicators to create a broad picture of the economy’s health – is also recovering. After a normal recession, a rise of about 2.5% above the previous low usually indicates a recovery. By the latest reading, the index is 9.8% above its lowest point in April.
Holding steady in rocky times
A positive view means we’re sticking with our preference for equities over defensive assets, although there could be further volatility towards the end of 2020 and into 2021.
The coronavirus pandemic may worsen over the winter before containment measures really take hold. An effective vaccine will take some of the heat off – the very positive market reaction to Pfizer’s announcement of successful trials in the second week of November indicates how this could mark a change in the market mood. And Brexit remains a headache for investors in the UK as a deal remains elusive and the 31 December deadline looms into view.
But a global and far-reaching view is forged deep into our investment process. Emerging markets have held up well and should continue to do so in our view, thanks to a weaker dollar. We also maintain significant exposure in Japan, where strong balance sheets and an effective response to the pandemic have buttressed returns. This diversified approach should continue to reduce the impact of localised volatility and help us catch the benefits of global economic growth.
long-term returns
|
30 September 2015 to 30 September 2016 |
30 September 2016 to 30 September 2017 |
30 September 2017 to 30 September 2018 |
30 September 2018 to 30 September 2019 |
30 September 2019 to 30 September 2020 |
MSCI AC World Index |
30.6% |
14.9% |
12.9% |
7.3% |
5.3% |
MSCI Emerging Markets Index |
36.2% |
18.6% |
2.0% |
3.7% |
5.4% |
MSCI China Index |
31.7% |
28.8% |
0.6% |
1.7% |
27.3% |
Coutts Defensive Portfolio |
9.9% |
4.2% |
1.4% |
5.4% |
-0.4% |
Defensive strategy benchmark |
14.4% |
2.8% |
2.3% |
11.1% |
2.6% |
Coutts Balanced Portfolio |
13.5% |
8.5% |
4.0% |
4.6% |
-0.4% |
Balanced strategy benchmark |
18.6% |
6.1% |
5.0% |
9.4% |
0.7% |
Coutts Growth Portfolio |
17.8% |
11.9% |
6.9% |
3.7% |
-0.8% |
Growth strategy benchmark |
22.4% |
9.7% |
7.7% |
7.7% |
-1.7% |
Past performance should not be taken as a guide to future returns. Portfolio performance figures are composite returns from the actual portfolios of all clients calculated in sterling, shown on a total return basis and quoted net of all fees. For the composite portfolio performance calculation, individual portfolio monthly returns are asset-weighted based on their respective asset values at the beginning of the month. Benchmarks represent a static mix of equities and bonds in proportions relevant to each strategy. Source: Coutts & Co, November 2020.