
A positive end to a remarkable year
We reflect on markets in December and how we navigated the ups and downs of 2020.
3 min read
SHARE
Most Popular
-
Ukraine invasion: Keeping our clients informed | Coutts
15 Mar 20221 min
-
Coutts and charitable giving in the Covid era
02 Dec 20214 min

Become A Client
When you become a client of Coutts, you will be part of an exclusive network.
As 2020 drew to a close, global equity markets were still flying high following positive news about vaccines and supportive stimulus measures by central banks and governments.
While rapid deployment of the vaccine boosted investor confidence, a resurgence in coronavirus cases led to further widespread lockdowns across the UK and Europe. The MSCI AC World Index reached a record high in December and finished the month up 2.2% (in sterling terms, including income).
Dollar weakness benefits UK equities and sterling
UK equities performed well during December, with the MSCI UK Index ending the month up 3% (sterling terms, including income), although at the end of the year they were well below other developed markets, with a fall of -13.2% for 2020 as a whole.
UK markets have a bias towards economically sensitive sectors (those that typically benefit during times of economic growth), including financials, energy, leisure and hospitality, that were hurt by the period of economic stress during the lockdown, dragging down overall performance.
At the same time, the technology sector – which benefitted from the increased take-up of remote working, streaming entertainment and games – is small relative to other regions. In December, the trend was flipped as hopes of recovery saw money move from tech to the previously unloved sensitive sectors, and we could see this pattern continue in 2021 as the recovery continues.
“Despite the stock market sell-off during the first quarter of 2020, performance was positive across all Coutts funds and portfolios for the year.”
Risk framework adds layer of protection
Despite the stock market sell-off during the first quarter of the year, performance was positive across all Coutts funds and portfolios. One of the key factors behind our positive return is our robust risk management framework. We’ve spent years developing the framework and researching the best ways to reduce volatility while also providing opportunities for growth. Performance this year reflects the benefit of that work.
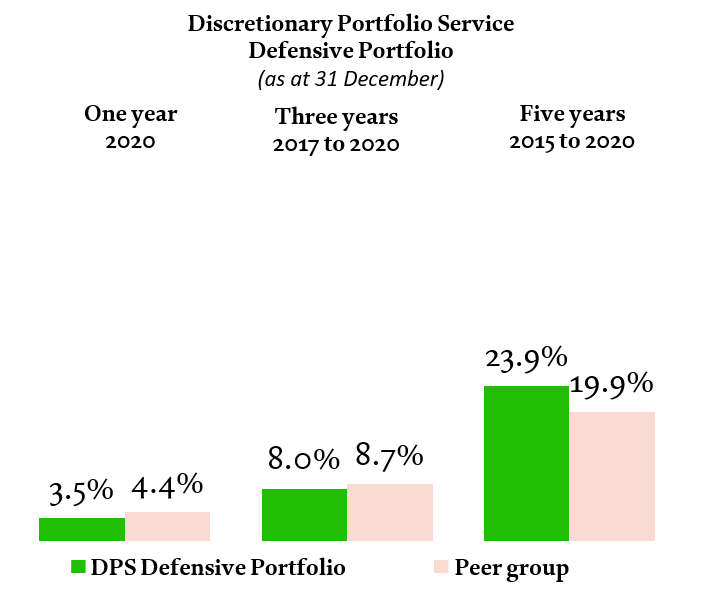
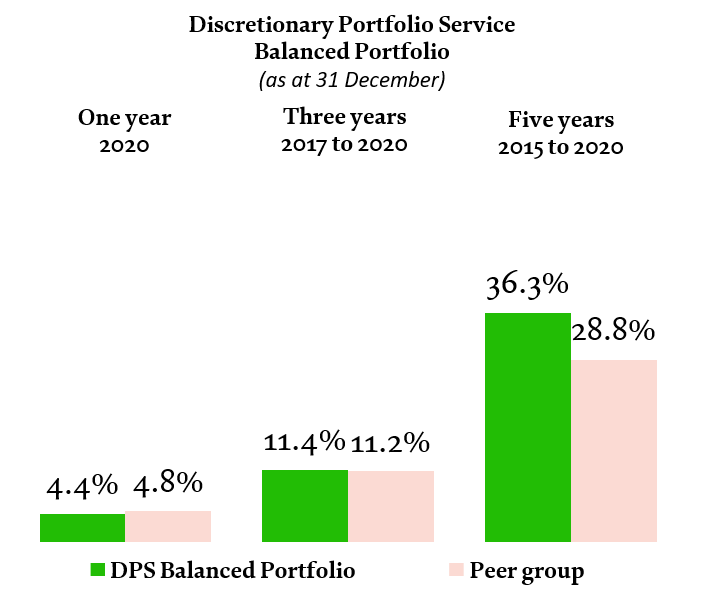
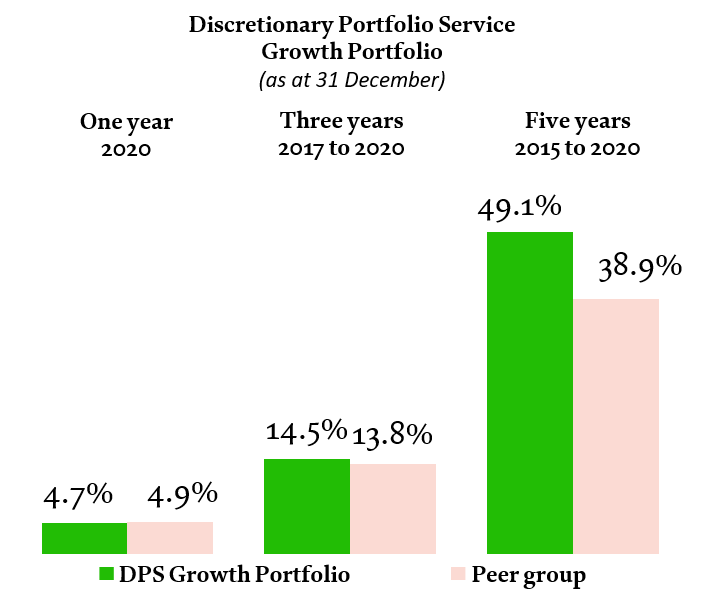
Cumulative returns calculated on sterling basis, including fees, charges and income to 31 December 2020. These data are based on composite performance, individual portfolio monthly returns are asset-weighted based on their respective asset values at the beginning of the month. Peer group returns provided by Asset Risk Consultants (ARC); end-December data represents ARC estimate. Past performance should not be taken as a guide to future performance. The value of investments, and the income from them, can go down as well as up and you may not recover the amount of your original investment. Sources: Coutts & Co, ARC. January 2021.
Looking at the peak-to-trough performance between 20 February and 18 March, our Balanced Portfolio fell 16.7% while our benchmark fell 15.9%. Trailing the benchmark by just 0.8% represents a solid performance. According to independent calculations by ARC (Asset Risk Consultants), our 2020 drawdown for Balanced mandates was also less than the average of our peers.
While we’re proud of the decisions we made during the coronavirus crisis, our positioning before the sell-off made a big difference. Our risk framework made us a lot more aware of market risk, and we’d been adding to our position in government bonds since 2018; this really paid off in March during the worst of the market falls.
Of course, while considering this information it’s important to remember that you shouldn’t rely on past performance as an indicator of future returns. The value of investments, and the income you get from them, can go down as well as up and you may not get back the amount you invested. Also, these figures provide a limited snapshot – for more context please refer to the table of long-term returns at the end of this article.
Asset allocation decisions have boosted performance
While downside protection was part of our success story for 2020, we also benefited from our asset allocation decisions throughout the year. For example, we moved from 3% underweight in equities in the average balanced portfolio after the market falls in March to 4% overweight by the end of the year.
During this time, we’ve invested in US banks, Japan, emerging markets and Europe. These economically sensitive areas performed especially well during the November turnaround and we think they could continue to outperform in 2021.
A Christmas Eve Brexit deal
The UK’s departure from the EU has been one of the defining themes for the country’s financial markets since the June 2016 referendum, with the stock market and pound jolted higher and lower by the vagaries of trade talks. On Christmas Eve negotiators reached a historic economic and security agreement, which guarantees tariff-free trade on most goods and creates a platform for future co-operation on issues such as data sharing.
The deal has resolved one of the major risks hanging over markets, giving investors more confidence that they can get back to the job of forecasting company prospects in a more stable environment. As well as pushing up the value of sterling, the good news rippled into the UK stock market, and in particular the FTSE 250, which is more sensitive to the outlook for the economy because of its heavier weighting towards domestic businesses.
Looking to the year ahead
While we’re still some way from emerging completely from the shadow of COVID-19, we believe that 2021 should be a more positive year for the global economy. Vaccines will continue to be rolled out and the economic recovery should pick up pace.
We’ve recently released our latest investment outlook, which includes a detailed look at our views on major asset classes, the opportunities and risks we see in the year ahead and the how we’re positioning our funds and portfolios to benefit.
Click here to find out more about our views on the year ahead
long-term market returns
|
31 December 2015 to 31 December 2016 |
31 December 2016 to 31 December 2017 |
31 December 2017 to 31 December 2018 |
31 December 2018 to 31 December 2019 |
31 December 2019 to 31 December 2020 |
MSCI AC World Index sterling |
28.7% |
13.2% |
-3.8% |
21.7% |
12.7% |
MSCI UK Index |
19.2% |
11.7% |
-8.8% |
16.4% |
-13.2% |
Coutts Defensive Portfolio |
8.4% |
5.8% |
-3.7% |
8.3% |
3.5% |
Defensive strategy benchmark |
12.8% |
5.7% |
-1.6% |
11.1% |
7.7% |
Coutts Balanced Portfolio |
12.2% |
9.1% |
-5.1% |
12.4% |
4.4% |
Balanced strategy benchmark |
17.6% |
7.9% |
-2.9% |
14.1% |
6.5% |
Coutts Growth Portfolio |
16.2% |
12.1% |
-6.5% |
16.9% |
4.7% |
Growth strategy benchmark |
21.8% |
10.4% |
-4.2% |
17.0% |
4.9% |
Past performance should not be taken as a guide to future returns. Returns calculated on sterling basis, including fees, charges and income. Benchmarks represent a static mix of equities and bonds in proportions relevant to each strategy. Source: Reuters Eikon/Datastream, Coutts & Co, January 2021.
Share