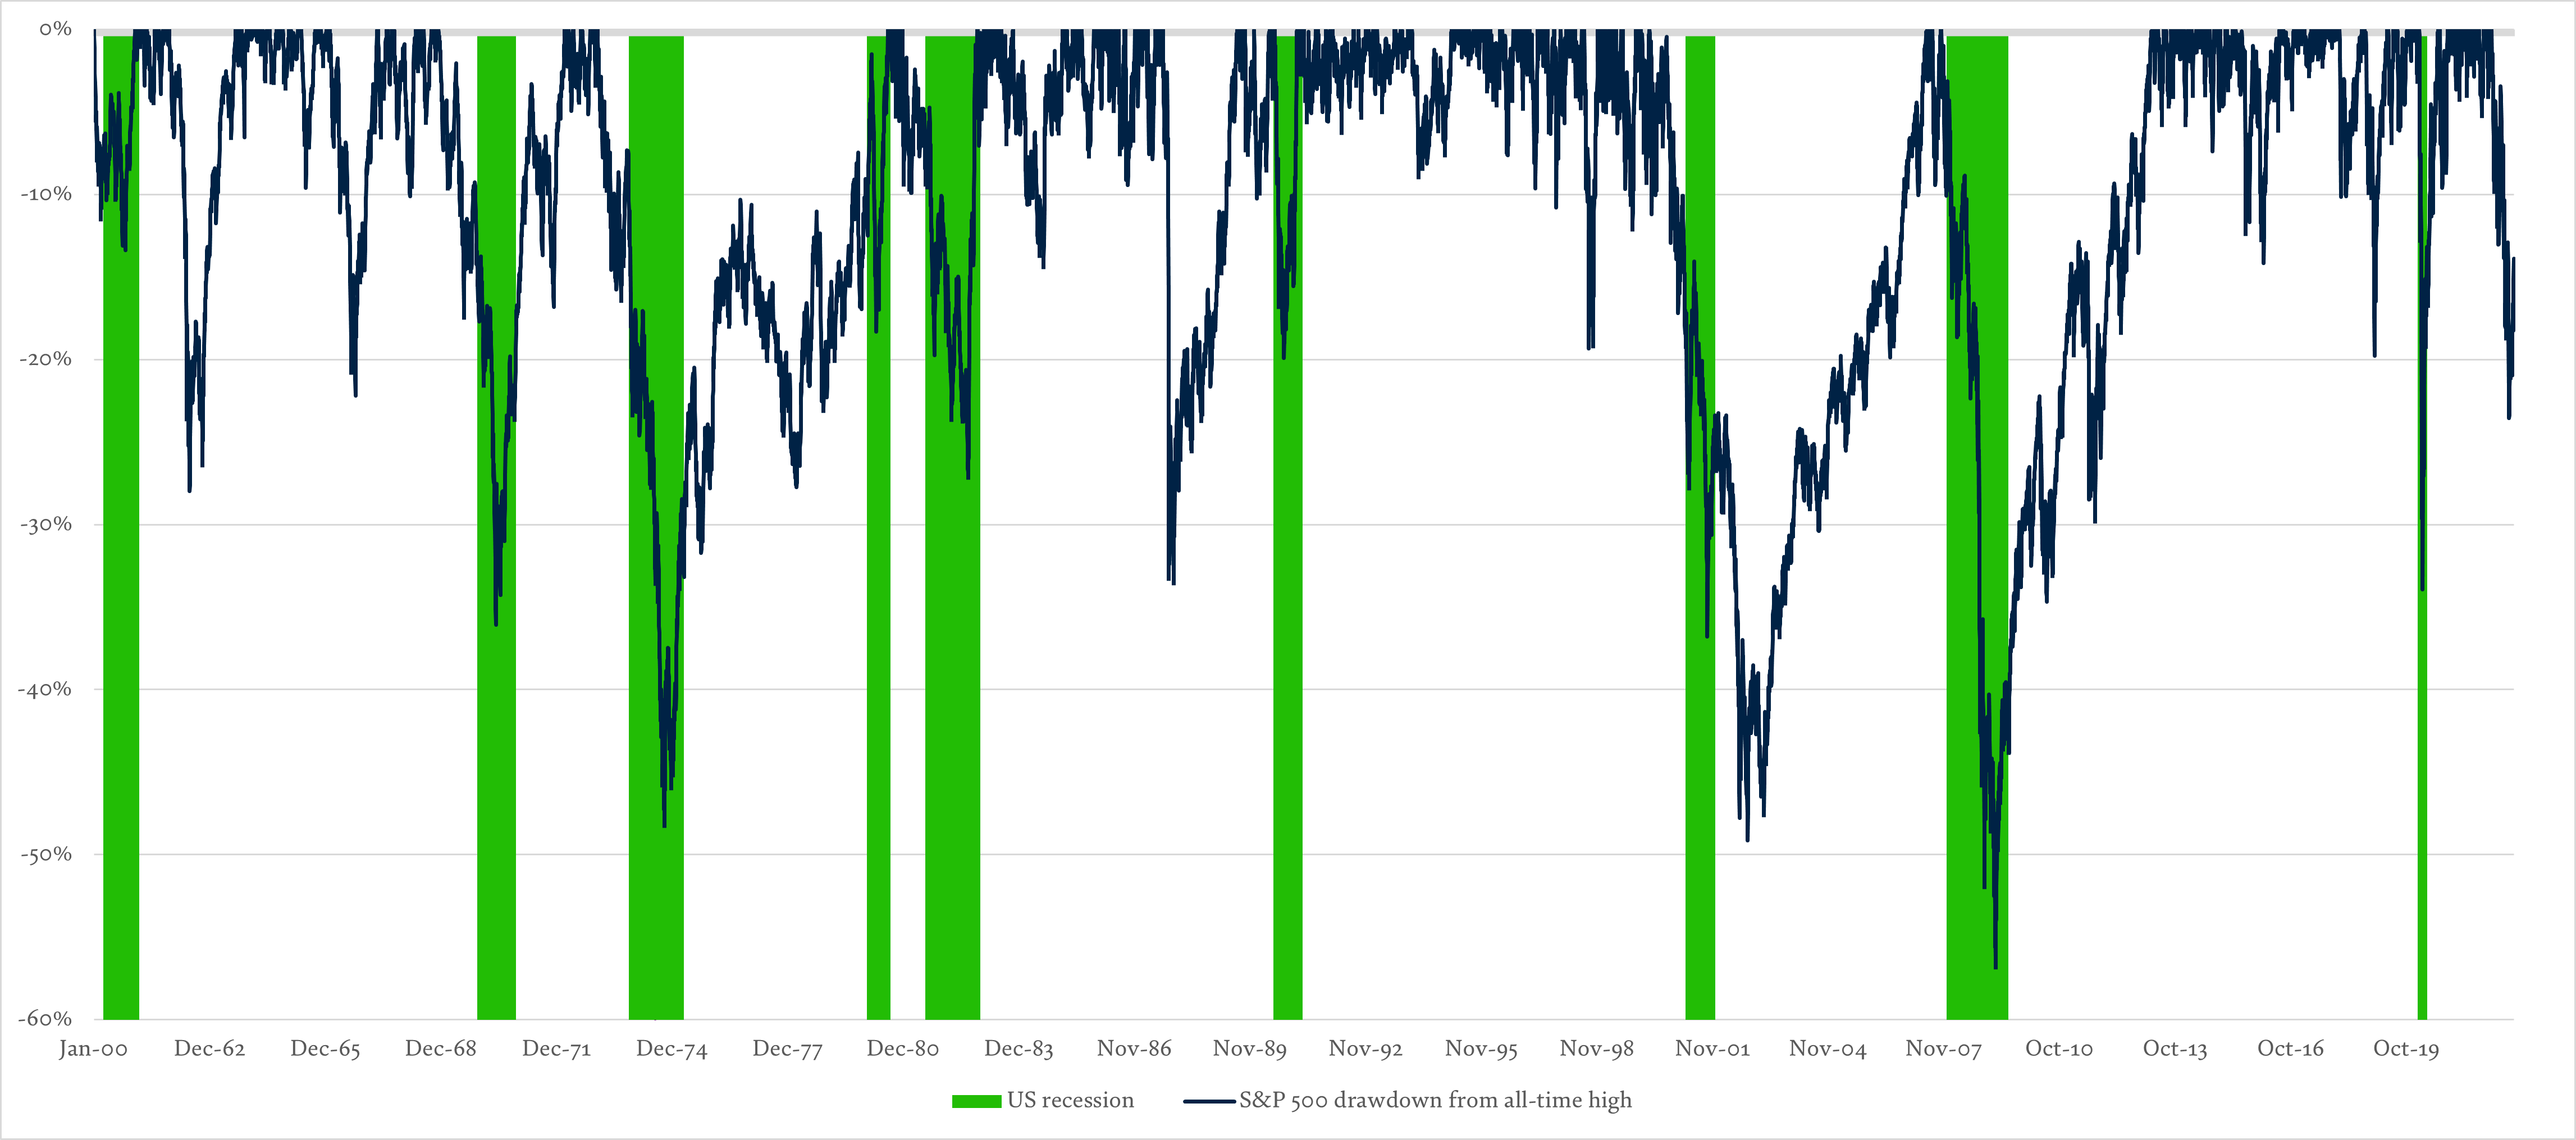
The billion dollar question is: how much downside is left? It’s impossible to know for certain, but one useful indicator is to look at the value of companies’ shares during previous bear markets. We can do this by looking at their ‘price-to-earnings (PE) ratio’, which relates a company’s share price to its earnings per share. During a bear market there often comes a point when companies with a low PE ratio are undervalued with too much pessimism. At this point investors will look to come back in to capture this opportunity. When this happens, markets usually stabilise and rise again.
The S&P 500’s current PE ratio (averaged across the index) is approximately 16.7x according to multpl.com and reflects a continuous downward trend since the December 2021 high of 35.96x PE ratio. While it’s still slightly above the historic average of around 16 times, it’s considerably lower than it’s been for a number of years.
Always remember though, that past performance should not be taken as an indication of future performance.
Bear markets can look alarming, but they are also an opportunity. If you're looking at long term investing, valuations are a much larger driving force of long term returns than the current economic outlook. Five-year time horizons can be far more rewarding than 12 month ones. And that means there is value to be had.
As Lilian says, “given what we've seen this year, which is not just markets falling 20% but many stocks getting cheaper by a sizeable amount, there could be an opportunity for investors to get a good deal, and for markets to start recovering”.