We’ve analysed the latest market developments and here are some of the key facts and figures for luxury property in London from the last quarter. This is based on what we’re seeing ahead of the next bi-annual Coutts London Prime Property Index, which will be out later in the year.
During Q2, we’ve seen significant variability across different areas of London in terms of deals done, prices paid and discounts received, which we’ve summarised below.
28.8%
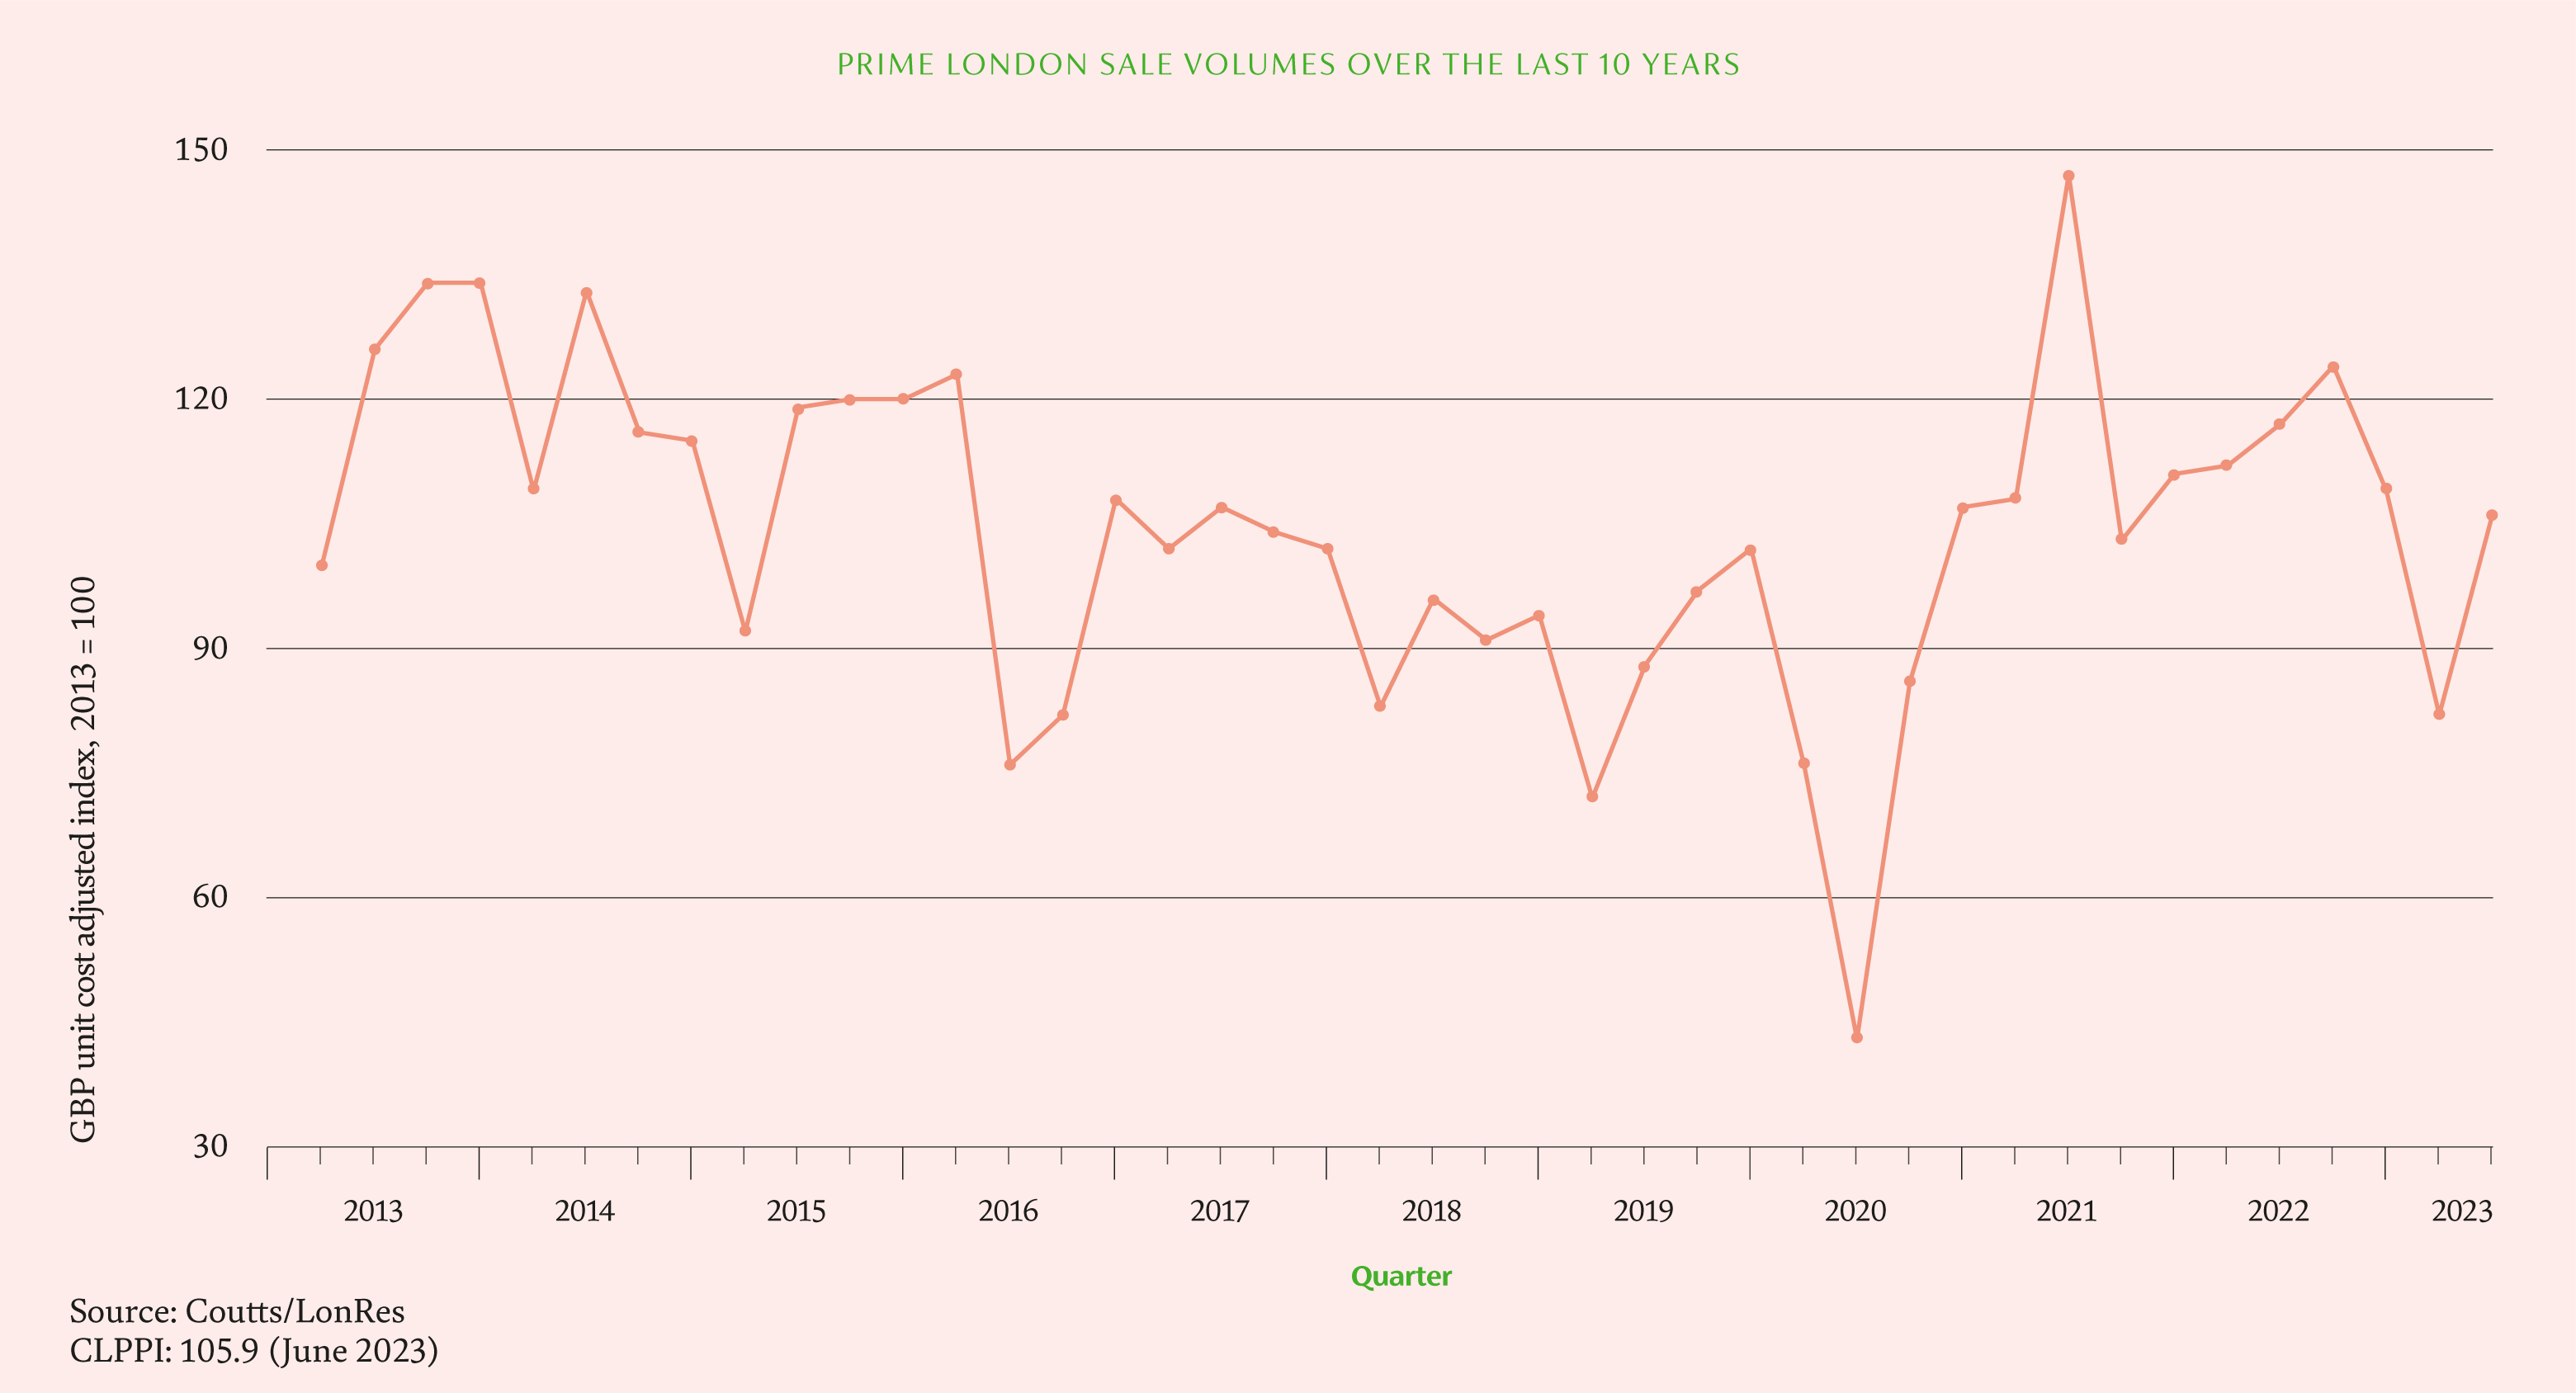
Q2 sales volume increase
5.7%
more properties for sale than last year
2.8%
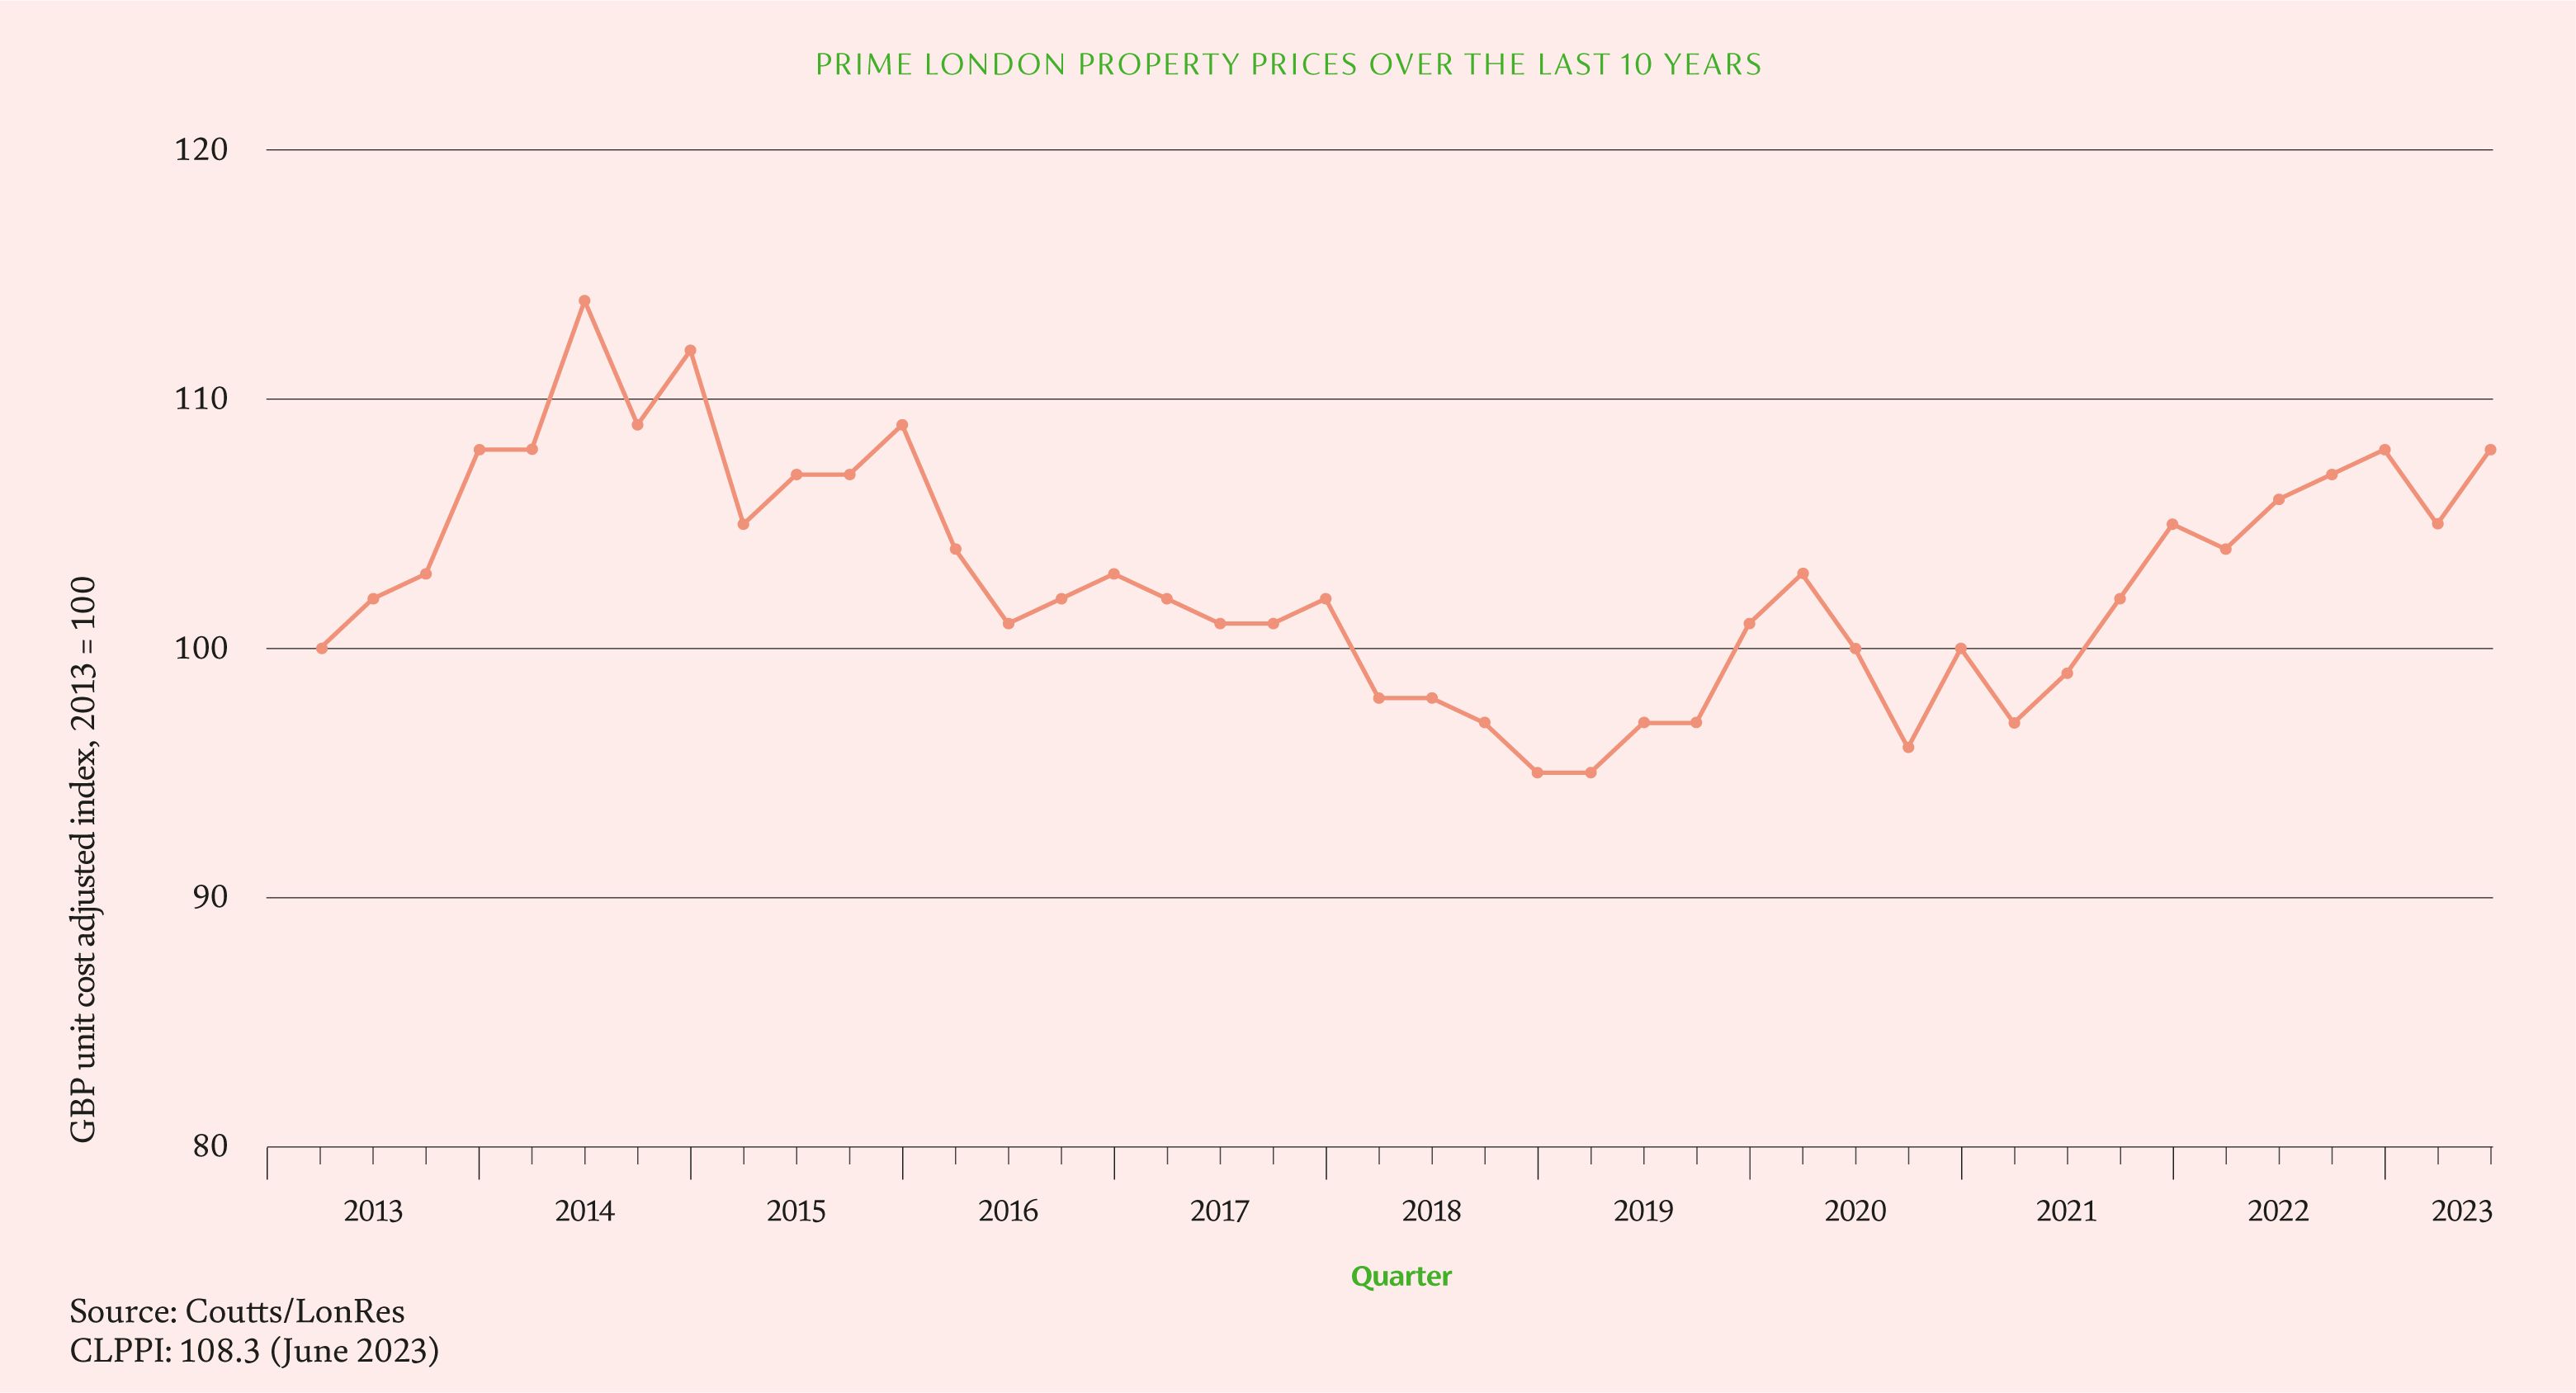
average price increase in Q2